February 5, 2020 - Determining Area of Segments in Histological Image based on Scale Bar
Lab Work
Today, I determined the length of the scale bar in the histological image and then applied that to the area of the segmented gonads using the Python script. There were four steps in completing this process: 1. Identifying where the scale bar was present in the image, 2. Measuring the scale bar, 3. Converting the scale bar measurement from pixels to um, 4. Applying the measurement to calculated pixel areas to get areas in um^2.
1. Identifying where the scale bar was present in the image
In order to identify where the scale bar was in the actual image, I used ImageJ in order to find the color of the bar and subsequently segment the bar out in Python via color segmentation. When I found the color of the scale bar in imageJ, I realized that the color of scale bar is completely black, and thus the RGB value is (000, 000, 000). Thus, using color segmentation in Python with OpenCV, I was able to find the scale bar and the associated letters and numbers indicating the length (50um). I used a size threshold to only identify the bar and not the numbers and letters. Here is the result (scale bar is in lower right corner, highlighted in blue):
2. Measuring the scale bar
I realized that the scale bar is a perfect rectangle, and thus placing a bounding rectangle around the scale bar would be representative of the actual perimeter of the scale bar line. Thus, I used these sources to help me make and draw bounding boxes around the scale:
Using the width of the bounding box (147 pixels) as the length of the scale bar, I got these values in Python with OpenCV:
In order to verify my results with another source, I also measured the same scale bar in ImageJ, and the results were very similar (length = 146.5 pixels)! (scale bar is highlighted in yellow):

3. Converting the scale bar measurement from pixels to um
Since I assumed the width of the bounding box was equivalent to the pixel length of the bar, I simply divided the actual length (50um) by the pixel length (147 pixels) to get a ratio of 0.34013605442 pixel/um.
4. Applying the measurement to calculated pixel areas to get areas in um^2
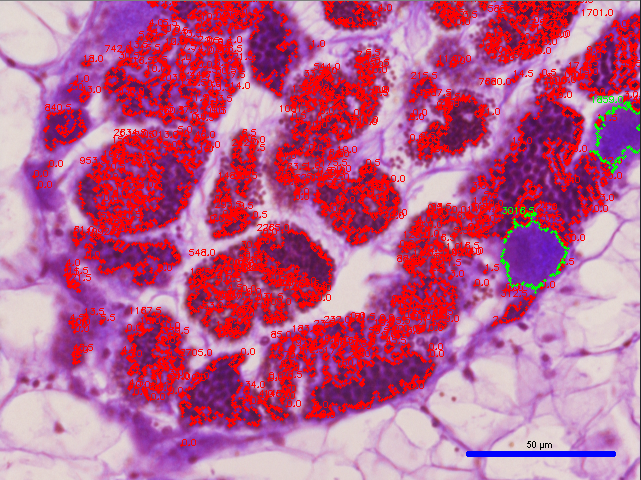
I had assumed that the area output that was given (shown in my previous post) was in pixels, but I think a more accurate description of it would be that it is in pixels^2. Assuming that the area output is in pixels^2 and assuming that each pixel had a width and height of equal length, I found the square of the ratio found in the previous step to get a ratio of 0.11569253551 um^2/pixel^2. Then I simply multipled this ratio by the area to get the area equivalent in um^2. Here ae the results that I got:
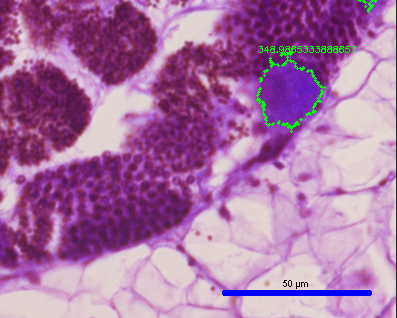
Using one of the eggs in the image as an example, using Python with OpenCV, I got an area of 348.98 um^2 (seen in the image below):
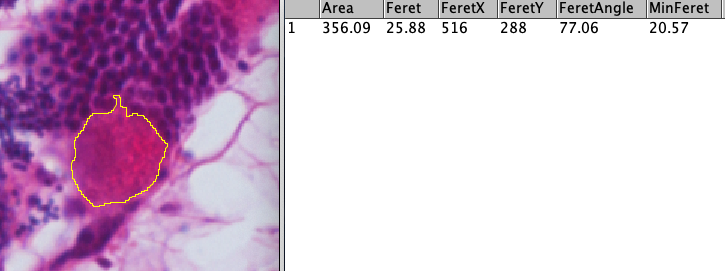
In order to verify my results with another source, I measured the area of the same egg in ImageJ and got an area of 356.09 um^2, which is very close the area I got using Python with OpenCV (see image below)!:

I realize that I made many assumptions in the 4th step, and thus it is important that I verify these assumptions in order to create the most accurate output as possible
Next Steps
- Verify assumptions made with area and pixel parameters
- Test out script on other images to see replicability


