
March 2, 2020 - Continuing to Figure out how to make a new contour
Lab Work
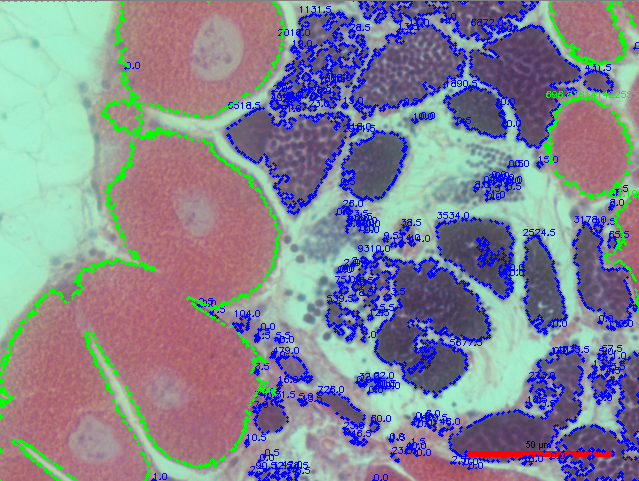
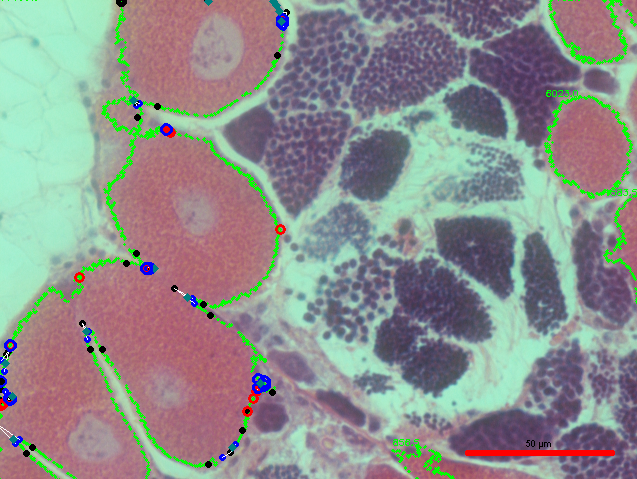
Today, I continued to segment the contour in the image of interest (seen below) in order to measure each egg in the image:
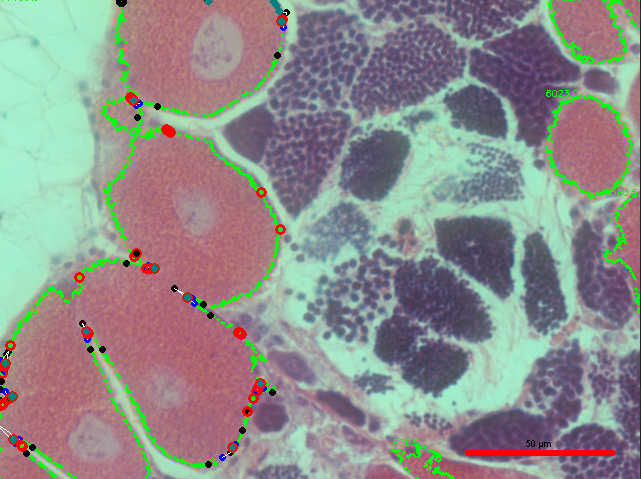
Last week I had difficulty finding the intersection points of the lines that I had made in order to segment the contour of interest, but after separating the point-slope equation that I was using into the correct quantities, I received this output (intersection points seen in red):
This output produced a lot more intersection points than I was anticipating, and then I realized that all contour points were ones that intersected with the lines that I had made (seen in this image):
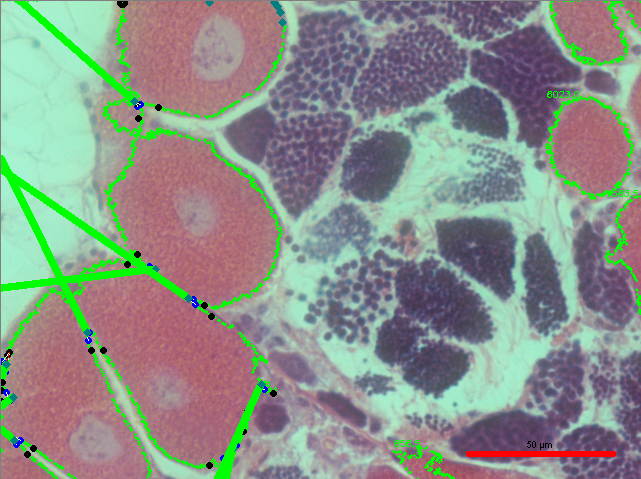
More specifically, not only the line segments themselves, but every point through the entire line as well. Thus, in order to reduce the total number of intersection points, I filtered the points by their direction relative to the convexity defect point, which produced this image:
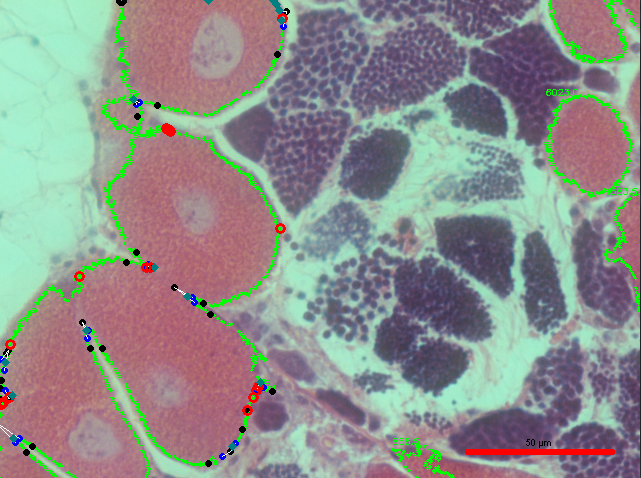
and then finally filtered it by distance to the convexity defect point, which produced this image (distance filtered points seen as big blue circles):
These sources helped me through my thought-process:
https://stackoverflow.com/questions/328107/how-can-you-determine-a-point-is-between-two-other-points-on-a-line-segment
- How can you determine a point is between two other points on a line segment?
- How to complete/close a contour in python opencv?
I then was having a little bit of trouble of finding the way to actually make the contours given the points and the patterns of the placement of these points on the contour.
So, I spent rest of time cleaning/reformatting script and trying out another image to see replicability of the code. The image I used was:
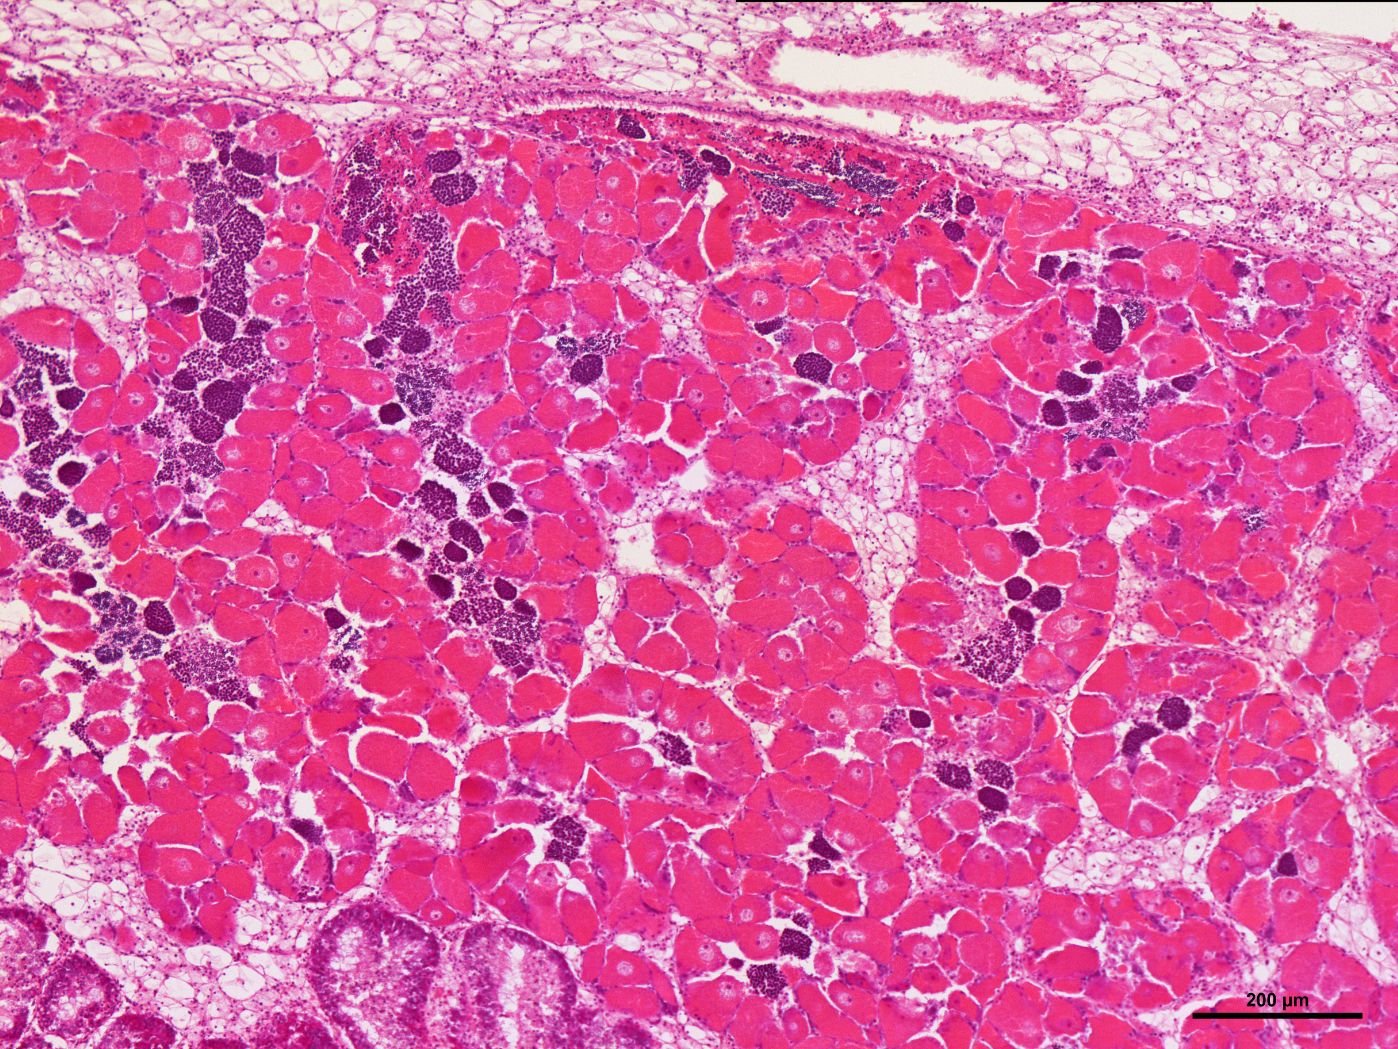
This is the RGB color map that was produced:
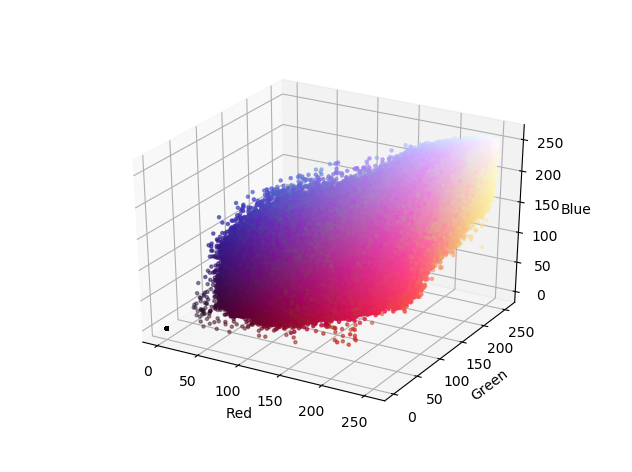
It’s important to note that it took a really long time for this plot to be produced, even when I used a computer with a high processing power. So, I may need to move to a computer with an even higher processing power or find a different way to visualize the colors plotted in the image. I think the reason why it took so long for this image to be outputted may have something to do with the fact that the file is a TIFF, so it may be useful to turn it into a JPEG or a PNG if I want to produce the plot more quickly.
Next Steps
Continue to try and segment contour and test replicability of code