
March 11, 2020 - Trying out new color segmentation method part 4
Lab Work
Today, I began to try and create a color plot to visualize the ranges of color thresholds I should chose to segment out the gonads in the histology images.
The article that I am looking at to guide me through this process did not specifically say how they loaded all of their cropped images in OpenCV, so I used this source to discover a tool called “glob”. But, when I used this tool in the script, I was not able to create the plots that were created in the article.
So, I tried to use the script on one image, and here was the associated output:
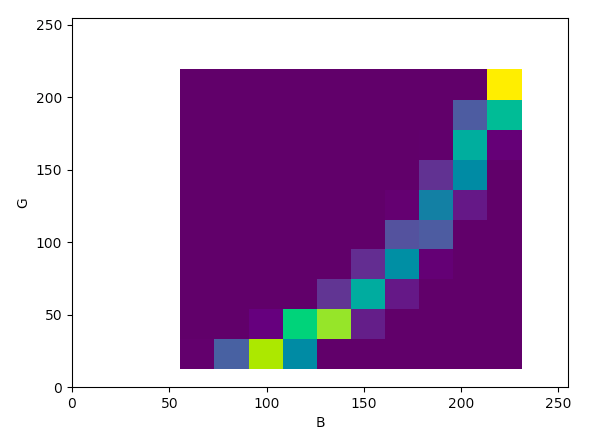
The values are much more spread out than I was expecting it to be, but that may be just because I used one of the histology images rather than one of the screenshotted images.
When I use a screenshotted image, here is the resulting output:

Next Steps
Combine all screenshotted images together to look at color scatterplot