
April 8, 2020 - Continuing New Image Segmentation Method
Lab Work
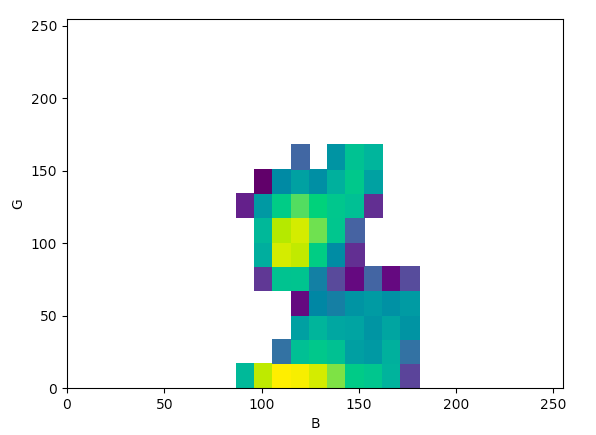
Today, I continued working on the new image segmentation method by following the instructions from this article. Last time, I had been able to produce a color threshold graph for eggs, but I realized that the graph that was produced was much more rectangular than the graphs that seemed to be produced in the article. Then, I realized that it was because I did not add in the LogNorm() function, but once I had done so, I produced this graph:
I was also able to produce a combined image for the sperm screenshots as well as produce a color space graph:
combined image:

graph:
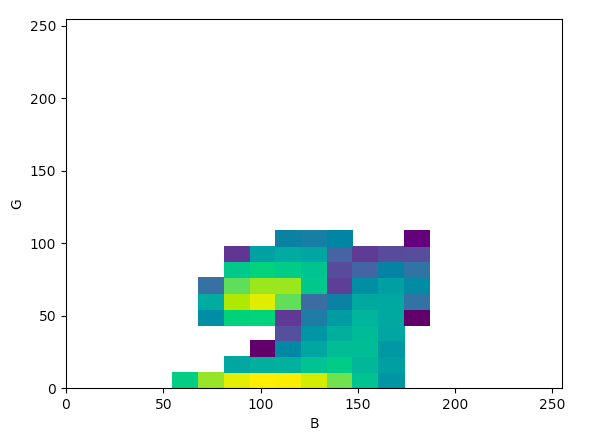
In terms of comparing the two graphs that were produced, it seems like both egg and sperm coloration is very similar when seen in RGB color spaces (the G and B values for both gonads overlap quite a bit), so the RGB color space may not be the best option in terms of deciding what color space to use to threshold the images.
Next Steps
Create graphs from different color space options to see if there is a better way to segment the images