
April 14, 2020 - Trying out Color Thresholds determined via New Color Segmentation Method
Lab Work
Today, I analyzed the scatter plots created with the help of this article to determine color thresholds that would hopefully be applicable to most (if not all) of the O. angasi histology images. I saw in the article that they only looked at 2 out of the three components for the color spaces HSV, YCrCb, and Lab, but I thought it would be useful to produce graphs for the other components of the color spaces as well, so that is what I did for both egg and sperm images:
Egg Images
HSV (HV): 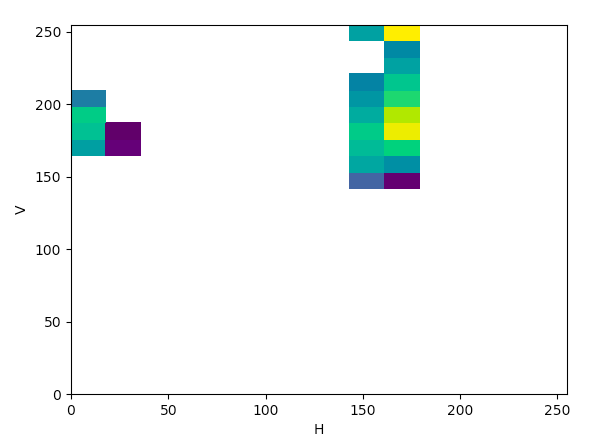
HSV (SV): 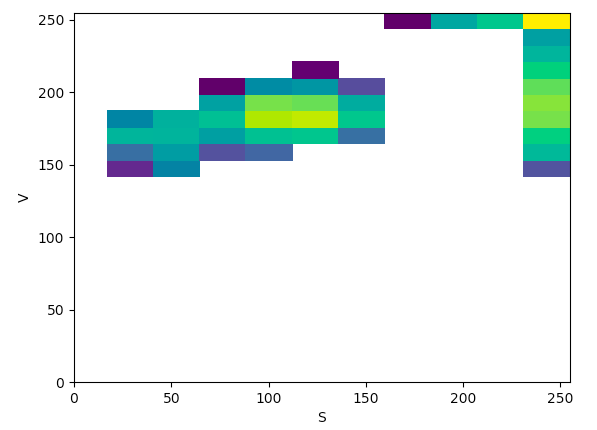
YCrCb (YCr): 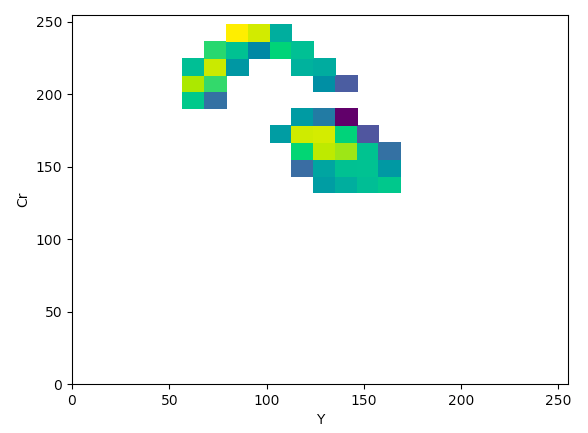
YCrCb (YCb): 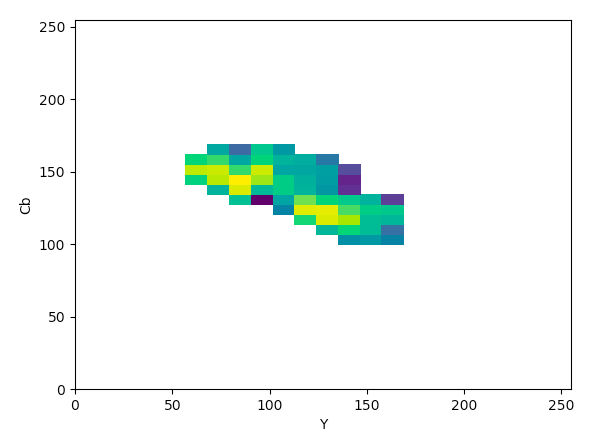
Lab (La): 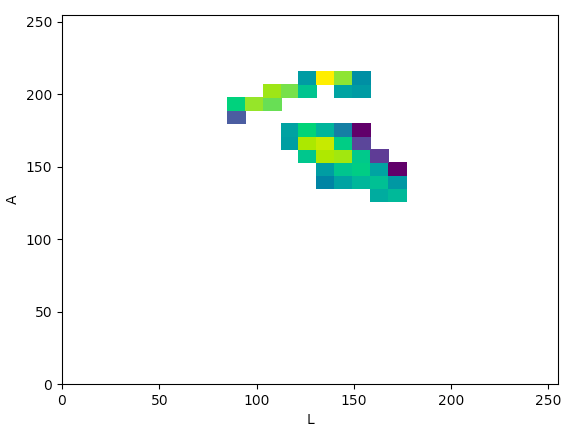
Lab (Lb): 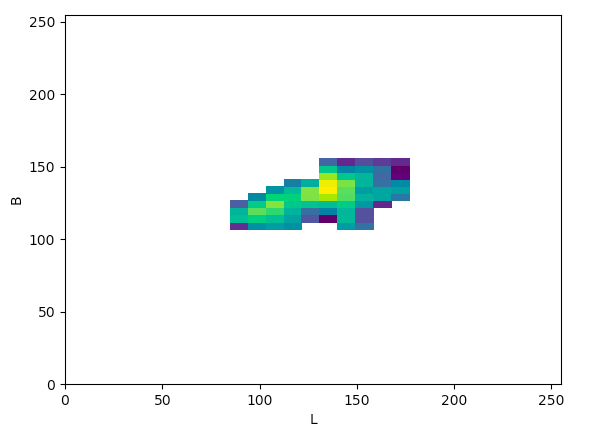
Sperm Images
HSV (HV): 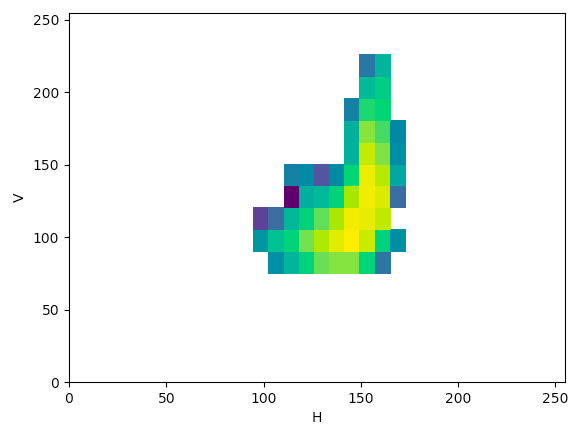
HSV (SV): 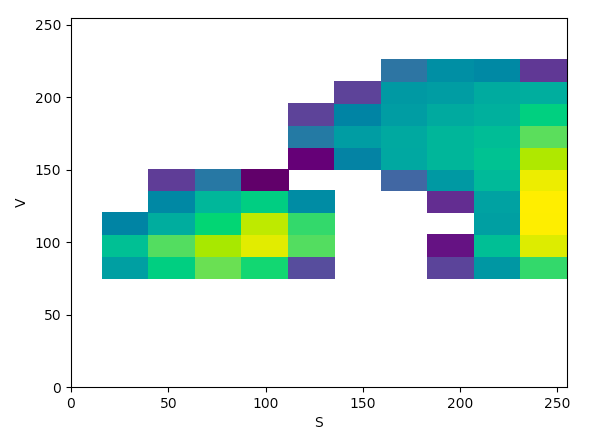
YCrCb (YCr): 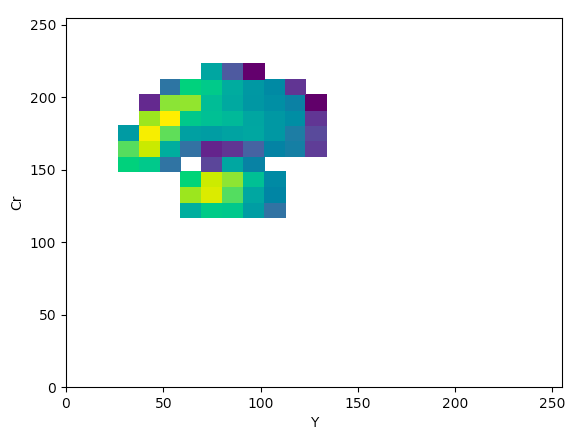
YCrCb (YCb): 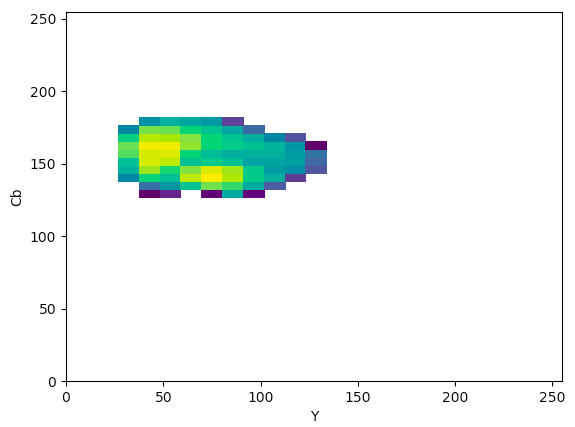
Lab (La): 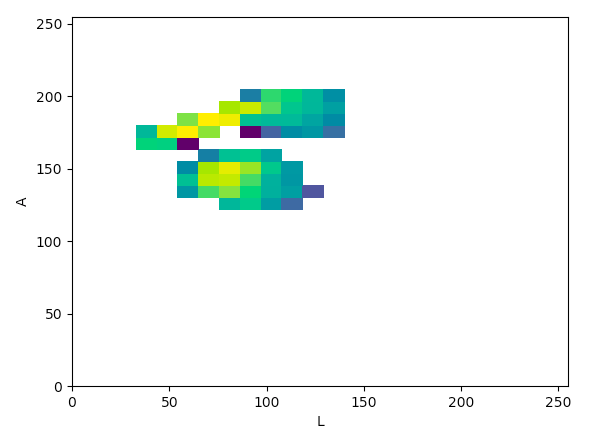
Lab(Lb): 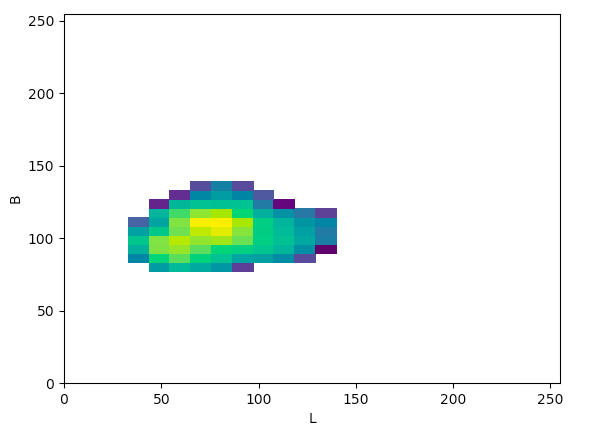
The article states that to help determine what color space would be ideal to base the color threshold on, it would be ideal to find the “most compact/concentrated density plot for color channels”. The article determined that the HSV color space would be the most ideal for their images, but after looking at the plots that were produced for the histology images, it seemed like the Lab color space would actually work the best to threshold the histology images, which I thought was interesting.
These were the thresholds that I used for each color space:
BGR
min: [80, 0, 140]
max: [160, 175, 250]
HSV (since it seemed like there were two separate areas that had values associated to it, I just used the largest area as the threshold values)
min: [140, 20, 140]
max: [180, 165, 250]
YCrCb
min: [60,125,100]
max: [170,245,175]
Lab
min: [80, 125, 110]
max: [175, 220, 160]
So, using the thresholds that were produced from the plots, I tried to see the segmentation results for egg in a couple images, and the results were actually quite promising:
image = 20180924-angasi121-40x
BGR result: 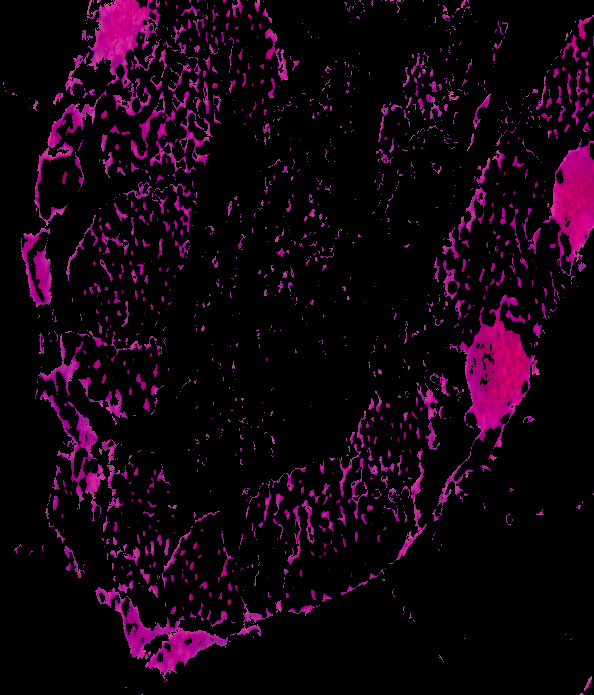
HSV result: 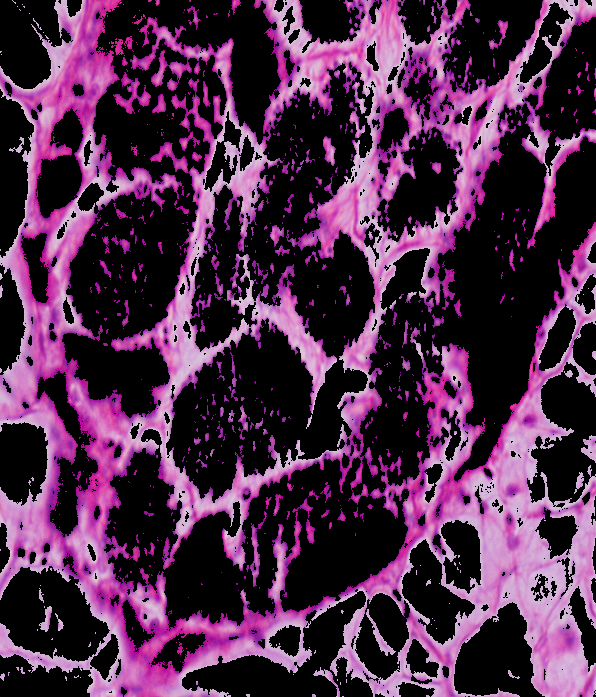
YCrCb: 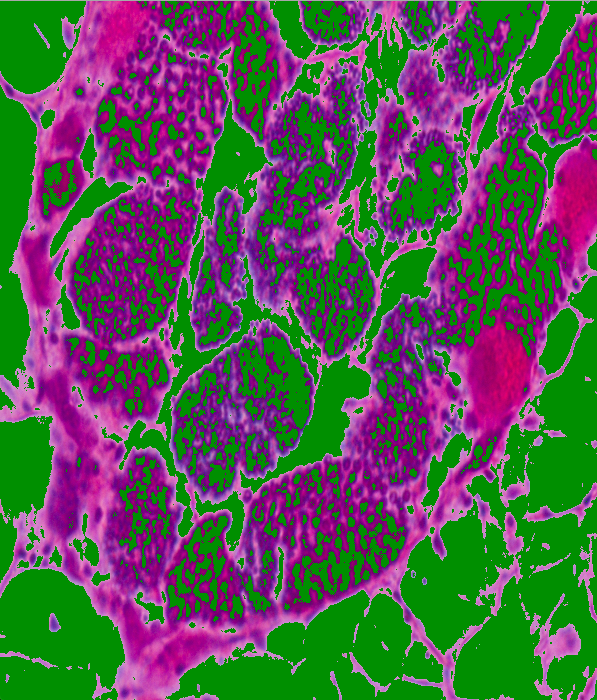
Lab: 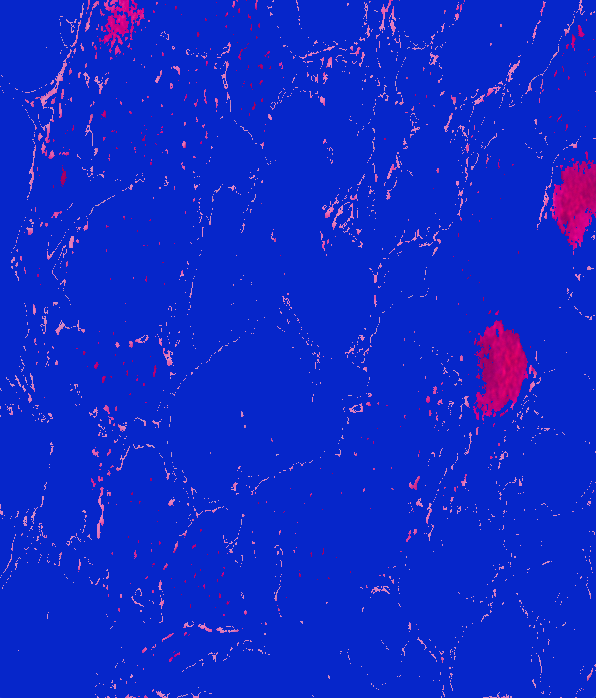
image = 20180924-angasi162-40x-scale
BGR: 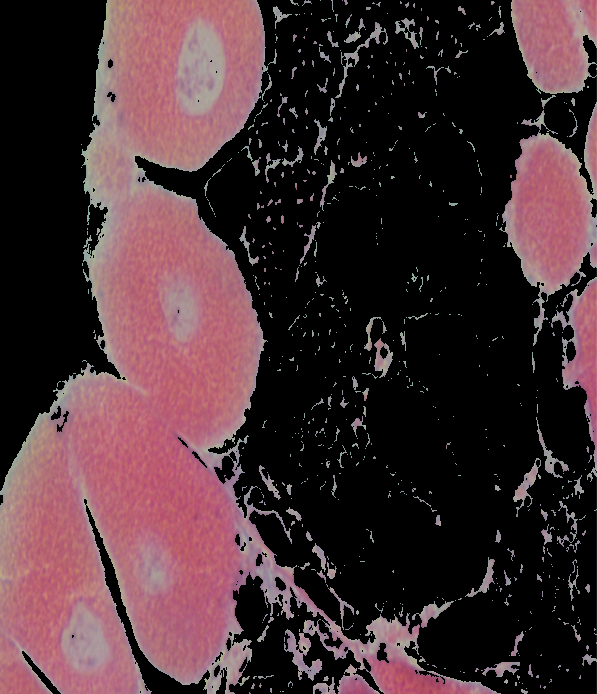
HSV: 
Lab: 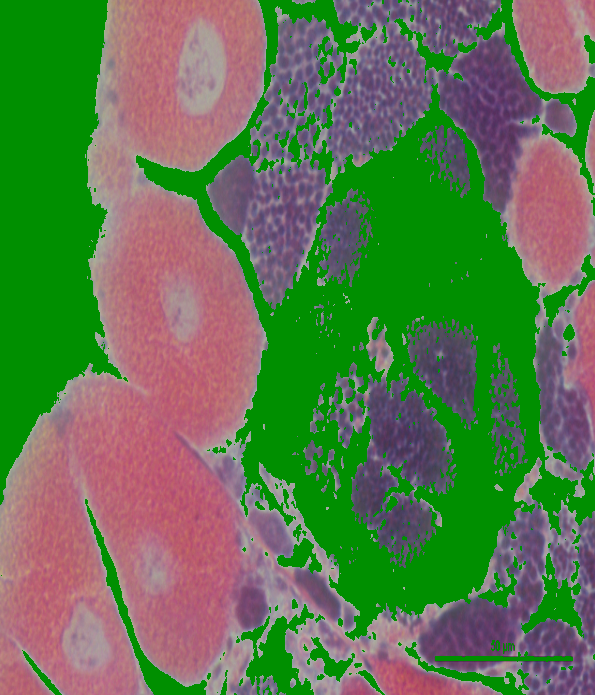
Lab: 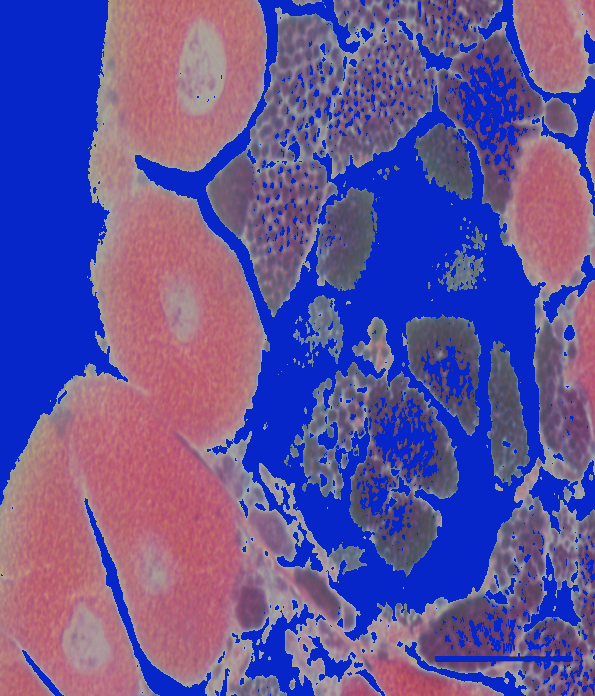
My only concern is that when looking at these two images, it seemed like Lab produced the best segmentation result for the first image, but BGR/HSV produced the best result for the second image. But, since I only looked at two images, it may be best to use these thresholds on a few more images to determine what the best overall color space to use would be.
Next Steps
Determine the accuracy of color thresholds to segment images