
May 4-13, 2020 - Update on Histology Image Thresholding
Lab Work
Modifying Color Thresholds
In my last post, I showed the results of male and female gonad segmentations made using color thresholds set. But, after speaking to Laura and Dr. Roberts, it seemed it would be the most reasonable to only use the 10x images to predict the gonadal sex of a sample, since the lowest magnification image would show the most total gonad area for that sample out of all of the magnifications. Thus, the color thresholds were redone to only include egg and sperms samples from 10x images and produced these color thresholds:
BGR_egg: [0,0,130] to [155,35,250]
HSV_egg: [140,210,130] to [175,250,250]
YCrCb_egg: [40,185,85] to [110,250,170]
Lab_egg: [65,175,105] to [145,215,195]
BGR_sperm: [5,0,0] to [110,40,148]
HSV_sperm: [110,95,20] to [180,250,150]
YCrCb_sperm: [10,122,122] to [55,195,160]
Lab_sperm: [5,130,95] to [80,180,140]
Sample numbers used to create these thresholds were randomly drawn (12, 103, 127, 10, 153, 163, 68, 30, 61, 66)
Producing Segmented Images
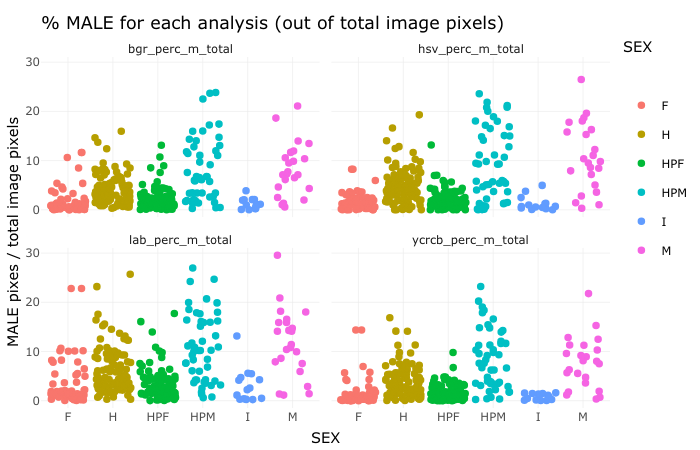
Color thresholds made throughout 4 different color spaces were done for a total of 329 10x images, and the male and female pixel area calculated for each of the color spaces per image can be seen here
Analyzing Results of Images
Laura wrote an R script that took the data collected from the image segmentation process to assess the accuracy of the segmentation done in comparison to gonadal sex determinations Laura had made qualitatively (the csv file of these sex determinations can be seen here). Thus, these plots were produced for male and female pixel area over total gonad area:
Female:

Male:
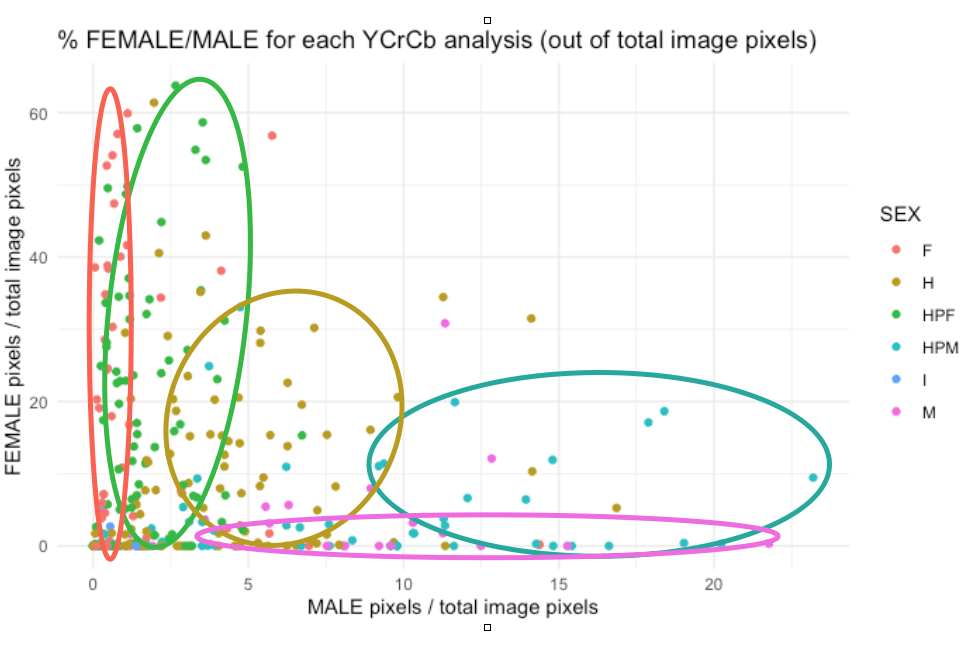
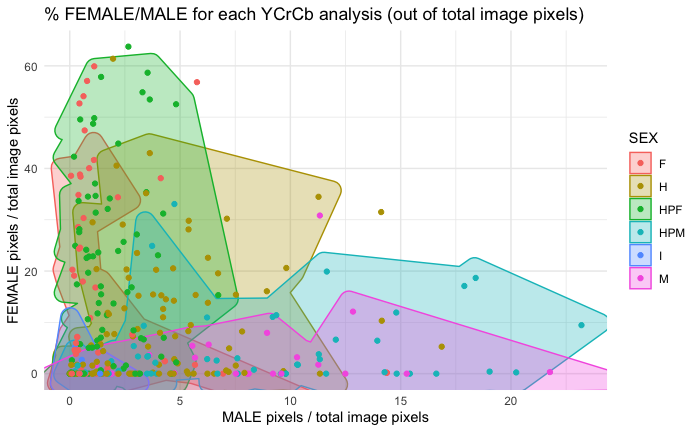
After looking through the script, I modified it so that we could see female versus male pixel area in an XY plot, and general patterns per sex type can be seen in this image created by Dr. Roberts:
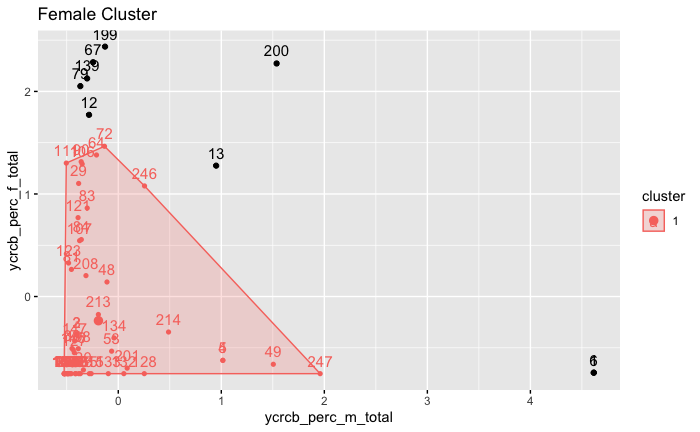
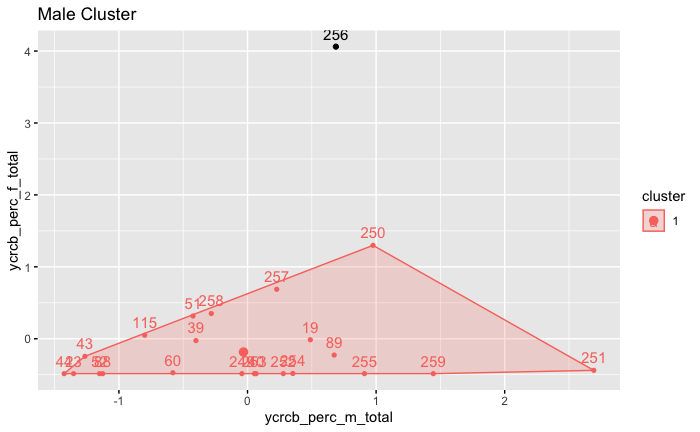
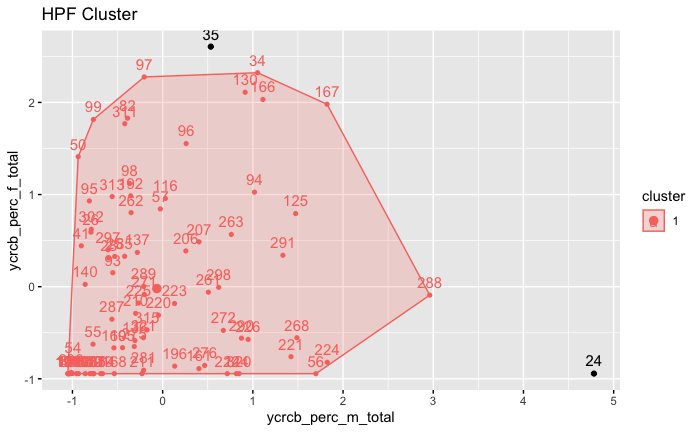
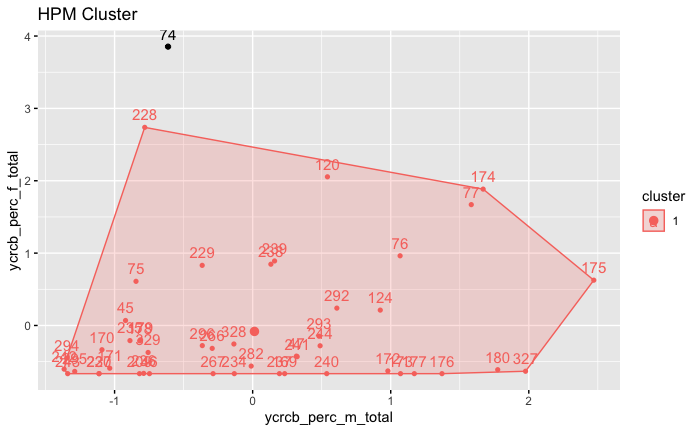
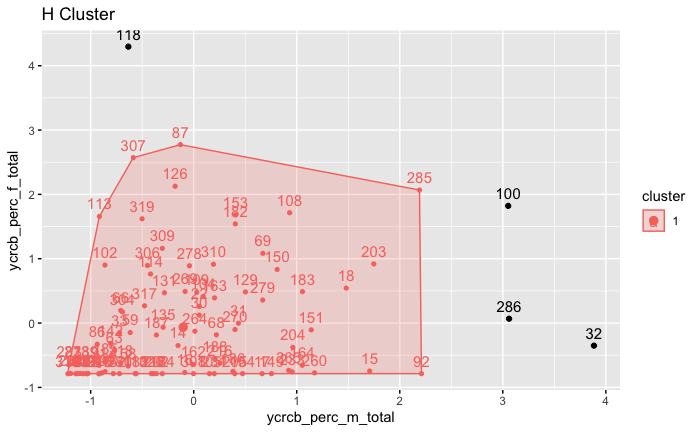
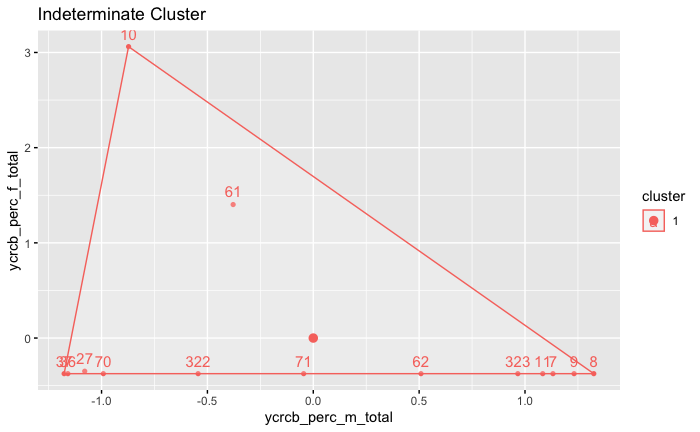
In terms of trying to cluster the sex type areas, I have tried to use DBSCAN to do this, using half of the total points per sex type as the min points parameter and basing the optimal eps parameter based on the min points, and produced these results:
F:
M:
HPF:
HPM:
H:
I:
Here is the resulting XY cluster graph that was produced from this:
Next Steps
Refine thresholds to increase likelihood of predicting correct sex type