
O. angasi Gonad Image Segmentation Protocol
For each image:
- Open the file segmentation_color.py
- Set “bar_length” equal to the scale bar length that is seen in the associated image
- Set “image_name” equal to the name of the image being analyzed
- Delete the # sign seen on line 34 for “pl.show()” and run the script to produce a graph equivalent to of all of the colors in the image (see example image below):
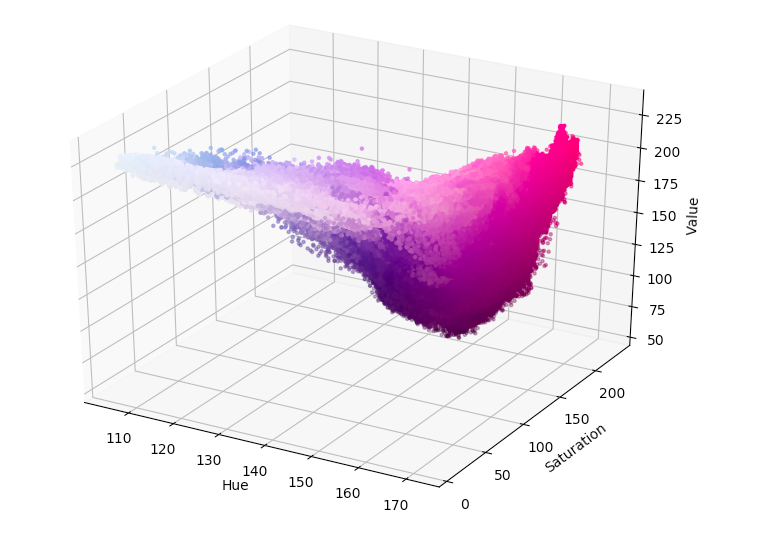 OR
OR
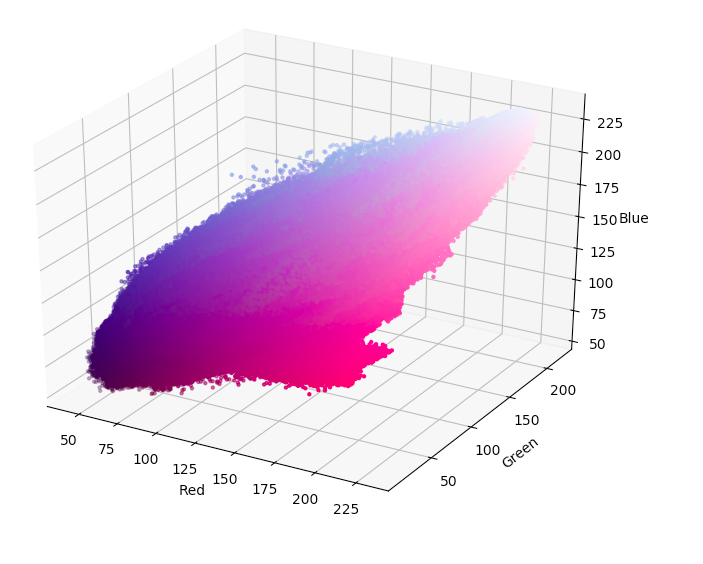
- Take a screenshot of the produced graph
- Open ImageJ and open the graph image in ImageJ using file –> open
- Place mouse over color area of graph that corresponds to the color of the gonad of interest and read corresponding RGB value that is stated in ImageJ
- Repeat this process until both the light and the dark color ranges for both male and female gonads are found
- Write the corresponding light and dark color values for the male gonad into “lightpurple” (line 37) and “darkpurple” (line 38), respectively.
- Write the corresponding light and dark color values for the female gonad into “lightpink” (line 41) and “darkpink” (line 42), respectively.
- If you would like to see if the color ranges match to what you previously thought:
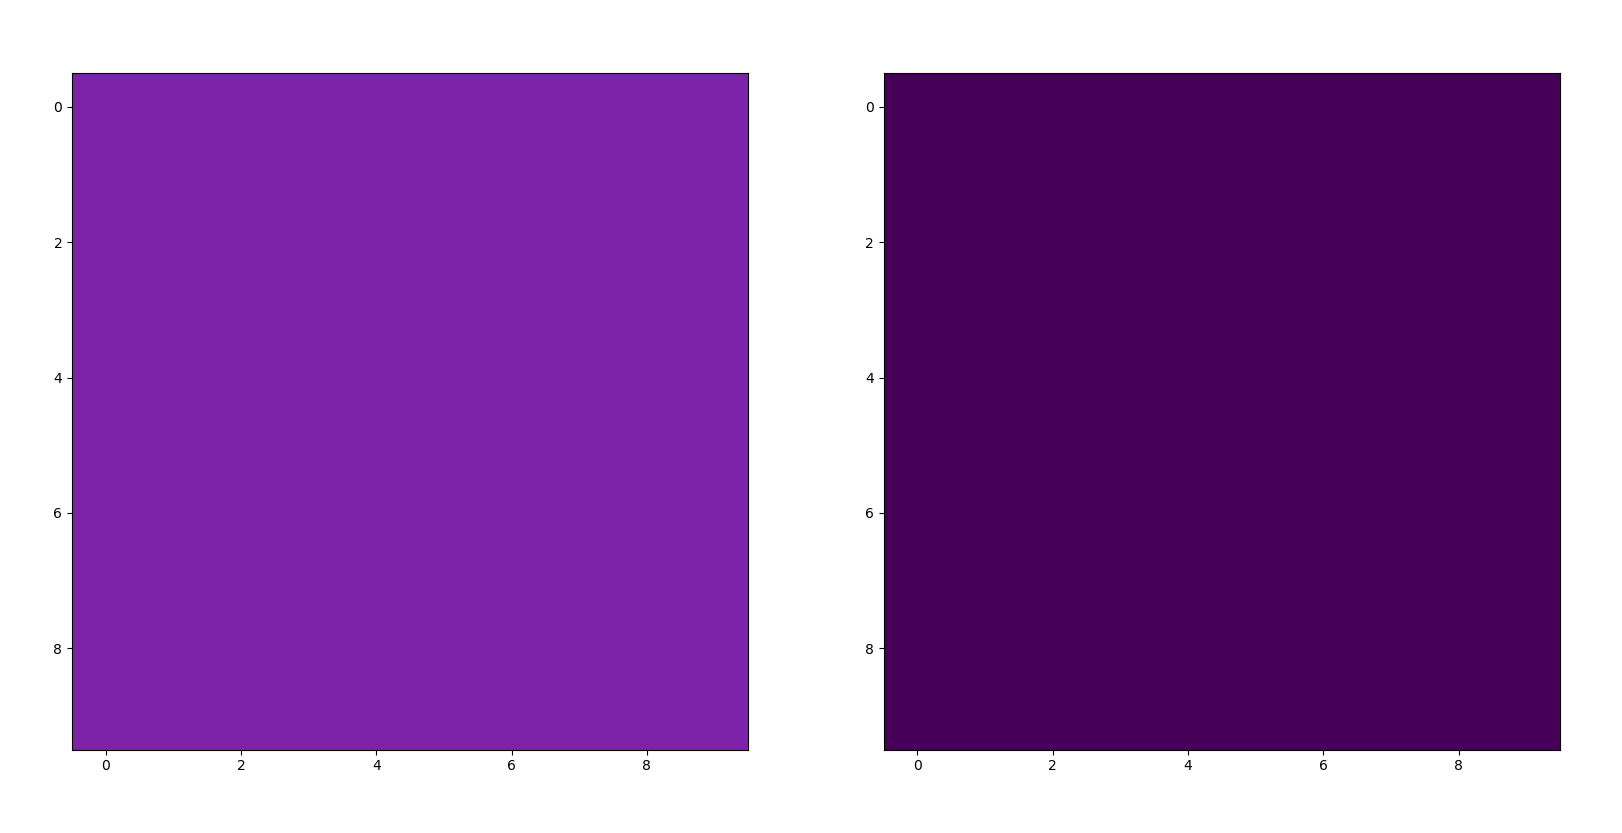
- put the corresponding light color in for “lpsquare” (line 45) and the corresponding dark color for “dpsquare” (line 46)
- Then, delete the # sign seen on line 53 for “pl.show()” and run the script to see the colors themselves (see example image below):
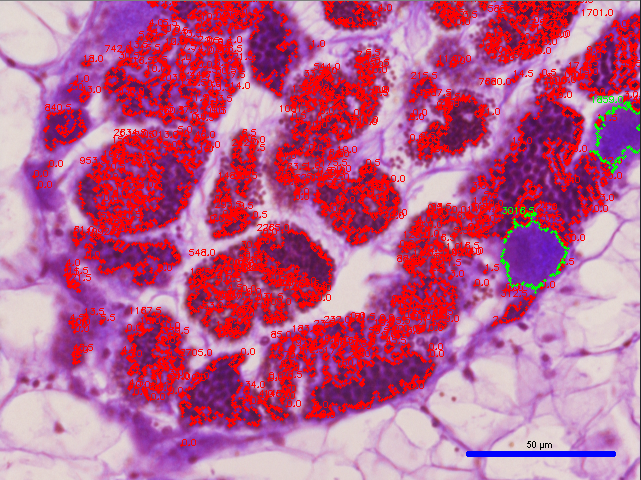
- Delete the # sign seen on lines 128 and 129 for “cv2.imshow(“Histoimage”, histo_image)” and “cv2.waitKey(0)”, respectively, and run the script to see the image segmentation output (see example image below):
- To see corresponding measurement outputs for the female and male gonads, Put a # next to all of the previously deleted # in the previous steps and run the script again to produce an output such as the one seen below:
